When imaging and building deepsolver we were possessed by the idea of combining speed and precision in Next-Generation Poker Solver. To change the game and aid poker professionals in pursuit of freedom, effectiveness and end-boss status. Today, we would like to share with you how we test and benchmark ourselves against competition and how we want to change your mind on what the word 'speed' can mean when we are talking about learning GTO strategies.
Speed is what you need
Standard solving involves building enormous game trees. These trees are then solved utilizing external servers or expensive hardware you must provide yourself in order to run your calculations.
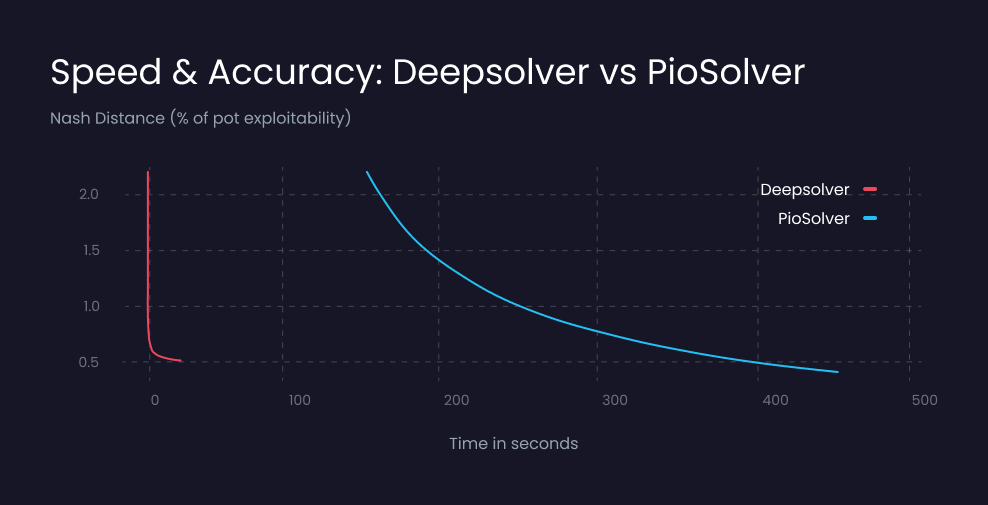
At deepsolver, we utilize the power of artificial neural networks to estimate EV at terminal nodes of the street. And that's why we are 10x - 100x faster than our competition. Check those speed benchmarks to see how we compare to the competition and what Poker Revolution is all about.
One thing to consider
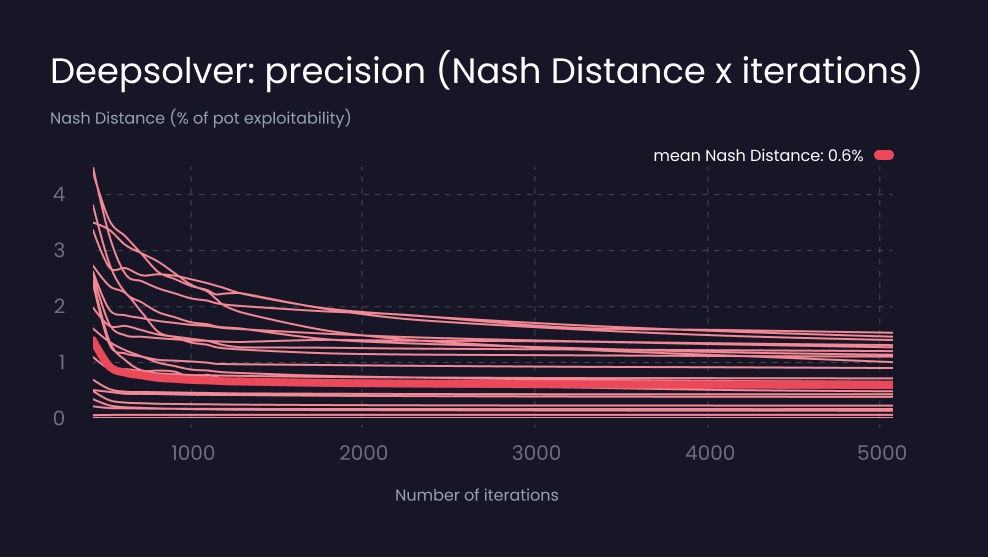
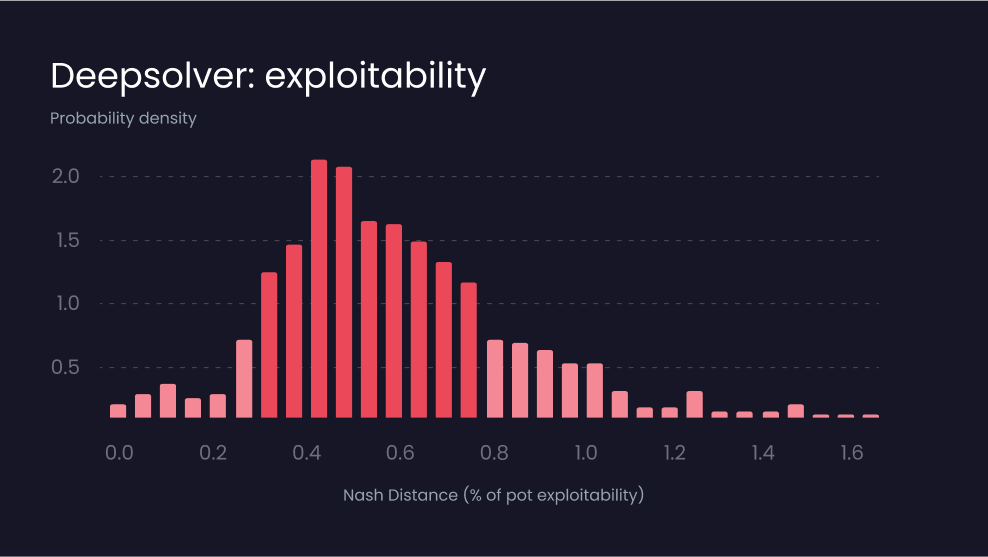
To get results on your screen in few seconds, instead of minutes, we combine traditional game solving algorithms with artificial neural networks. That means uber-fast calculations, but also some limitations. We are not able to provide exact Nash Distance and exploitability level due to the artificial neural networks limitation.
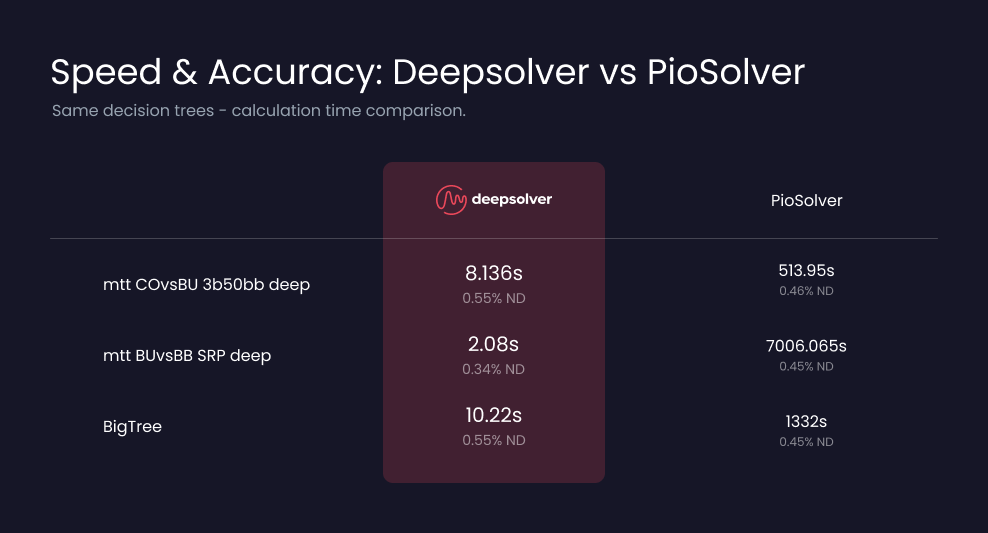
To make sure we deliver the highest possible precision, we run dozens and hundreds of benchmarks against our competition on different types of decision trees and ranges. When deepsolver is finished with the situation, we hand-lock it in previous-generation solvers to see if and by how much our strategy can be exploited.
Check those benchmarks below to see how accurate and how fast we really are:
We are fully committed to delivering our users with unprecedented speed and precision on the market of GTO learning tools. That's why we are constantly working on the quality of our neural networks and the precision and speed of your results. If you got any questions about our algorithm or technology and solutions we use - please let us know at: support@deepsolver.com or at our Discord channel.